The federal government hosts data.gov.au, where organisations such as the City of Yarra can publish datasets, and anyone can view, download or follow the datasets. The main purpose of the site is to encourage public access to and reuse of public data. It was created following the Government’s Declaration of Open Government and as a response to the Government 2.0 Taskforce Report.
Councils joining data.gov.au can follow the standards and recommendations published at opencouncildata.org. The Open Data Council’s initiative aims to maximise reuse and interoperability of datasets by promoting the release of specific high-value, commonly-available datasets, with standard data schemas. The goal is that datasets can be easily joined up for greater value (for example, state-wide register of trees) and apps developed for one dataset will work across council boundaries (for example, a bin night reminder app).
https://toolkit.data.gov.au/Starting_on_datagovau.html
Open Data is defined as:
Open data is data that anyone can access, use or share. Simple as that. When big companies or governments release non-personal data, it enables small businesses, citizens and … researchers to develop resources which make crucial improvements to their communities.
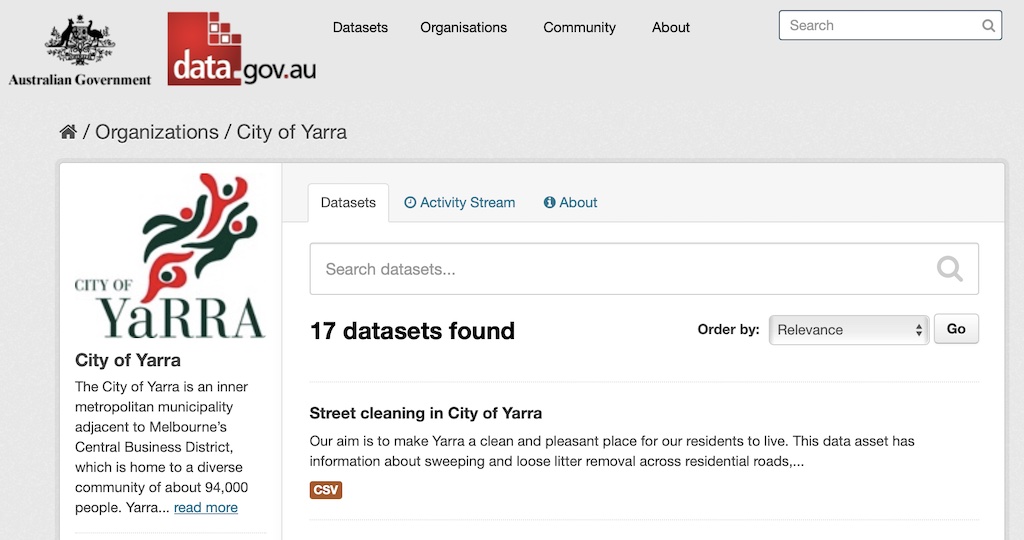
The City of Yarra has an account on data.gov.au and has published 17 datasets.
- Childcare centres
- 3D buildings
- Councillors
- Drainage pipes
- Heritage grading
- Parks and open spaces
- Permit parking zones
- Significant trees
- Speed limits
- Speed trailer locations
- Street and park trees
- Traffic counts
- Dumped waste
- Food establishments
- Material and child health clinics
- Schools
- Street cleaning
The most recent update was 2nd June 2021, to the street cleaning dataset. Some other datasets are marked as only being updated “infrequently”. For example, the “schools” dataset was last updated in 2020.
More data please
It would be useful if the City of Yarra published more open data, because this would enable residents to better understand where money comes from and where it is spent.
Example from USA
This image shows the revenue generated per unit of area, i.e. the city rates, showing how different neighbourhoods generate different levels of revenue, and highlighting that denser mixed-use development delivers more revenue per unit area than low density urban sprawl. With this data we can understand which neighbourhoods are subsidising others.

Data from Yarra
In Yarra, it would be useful if council published data for each neighbourhood (or LAPM area). For example:
- Revenue from rates
- Revenue from parking (permits, meters, fines)
- Expenditure on capital works
- Area
- Number of residents
With this data we could determine the revenue and expenditure for each neighbourhood, normalised by either area or number of residents. If the data was published each year, we could understand trends in revenue and expenditure. Even better would be to publish more data for each LAPM area, e.g.:
- Number of on-street car parks
- Number of bike parking hoops
- Number of pedestrian crossings or raised (wombat) crossings
- Number of trees
- Area of public open space
- Number of parking permits sold
Again, this data could be normalised by either area or number of residents. With this data we could determine which neighbourhoods have better infrastructure than others. We could compare the number of car parks with the number of permits that have been sold.
Conclusion
In today’s modern digital world, most data is stored electronically, and is easy to share. For residents, access to more data is better than access to less data. We call upon the City of Yarra to share more data, to give us a greater insight into council, and to enable us to compare neighbourhoods.
Published 5th August 2021