Following on from our previous articles on:
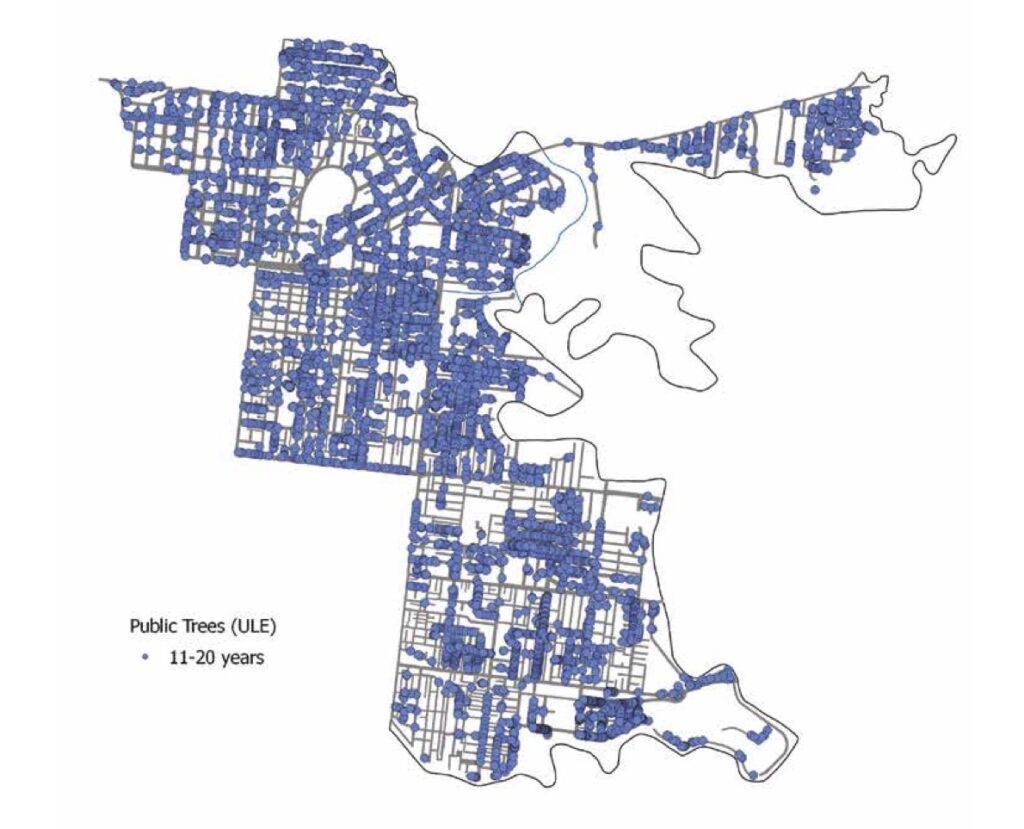
we suggest that a commitment to Open Government should also including publishing data in a form that can help residents and ratepayers to give feedback on priorities for future investment. For example, consider the Urban Forest Strategy, which includes a map of public trees:
The data can be presented in a clearer way by showing the number of council trees per unit area. Streets Alive Yarra has prepared the following image, using the dataset of street and park trees published by the City of Yarra, which was updated in January 2020, and the LAPM boundary map also from the City of Yarra. Data is presented in terms of neighbourhoods, i.e. LAPM areas, and it would be useful if most council data was presented in this manner.
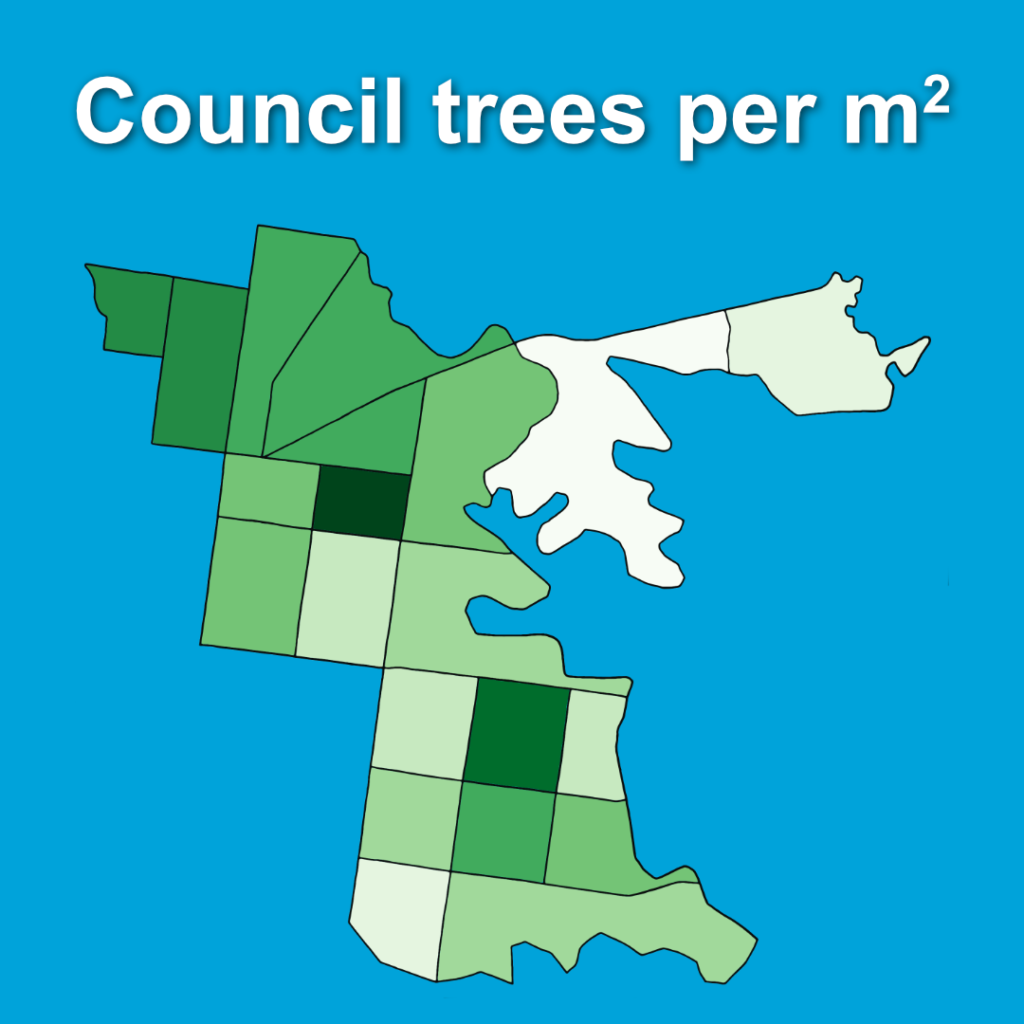
We can see that the neighbourhood of LAPM 10 Gold has the most council trees per unit area, as indicated by the darkest colour. The neighbourhoods with the lighter colours need to be prioritised for planting with more street trees, including:
Published 27th December 2021.